Airport curbside traffic simulator comparing LAX with four other US hubs, made by Opus 5.5 during an Uber ride (X video)
Conor Neu (@ConorNeu) · 2026-09-25 · ai-made · 174,822 views
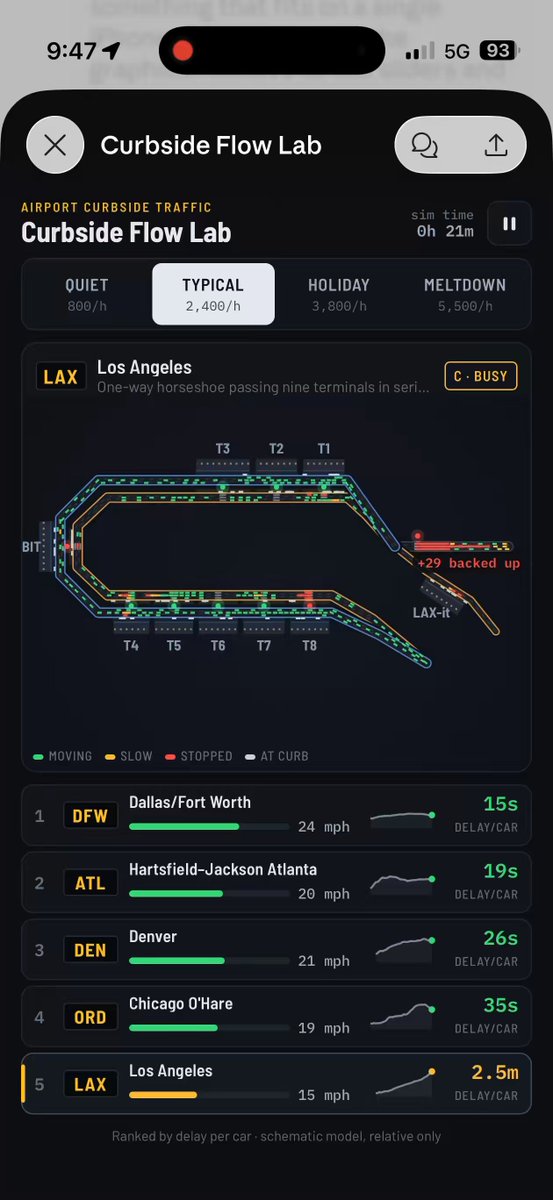
Made by AI
Model: Claude Opus 5.5 · Series: Agent-built app (the video shows the result)
Evidence: X post (2026-09-25): 'Flew back into LAX last night and was frustrated by the traffic flow. Got me wondering how bad it is vs. the other top 4 US airports. So I had Opus 5.5 whip this up for me on the Uber ride home. LAX traffic flow design is truly a disaster.'
Human role: Creator had Opus 5.5 build it on an Uber ride home.
Pipeline: Opus 5.5 → traffic-flow simulation app → 1:07 capture
What's in the video
Description written by Gemini, which watched and listened to the whole video.
Summary This video is a mobile screen recording demonstrating "Curbside Flow Lab," an interactive airport curbside traffic simulation app created by Conor Neu using Claude Opus 5.5 during an Uber ride. The app models and compares vehicle congestion and delay dynamics across five major US airports (LAX, ORD, DEN, ATL, and DFW) under varying volume scenarios ranging from quiet flow to full holiday meltdown.
What is shown
- [00:00] The "Curbside Flow Lab" UI on an iPhone screen, showing Los Angeles International Airport (LAX) in the "Typical (2,400/h)" traffic tier with a "C-BUSY" rating and cars looping around terminals T1–T8 and Tom Bradley International Terminal (BIT).
- [00:04] Selection of Chicago O'Hare (ORD), displaying its core loop passing T1, T2, and T3 with an "A-FREE FLOW" status and 44s delay/car.
- [00:08] Inspection of Denver International Airport (DEN) schematic, showing its single terminal with east and west curbs on stack at "A-FREE FLOW" (24s delay/car).
- [00:11] Inspection of Hartsfield-Jackson Atlanta International Airport (ATL), displaying split Domestic North and South curbs maintaining "A-FREE FLOW" (19s delay/car).
- [00:15] Inspection of Dallas/Fort Worth International Airport (DFW), showing five semicircular terminal loops branching off the central spine, operating at "A-FREE FLOW" (15s delay/car).
- [00:19] Toggling the traffic volume scenario up to "Holiday (3,800/h)", where DFW retains free flow.
- [00:23] Switching to LAX under "Holiday (3,800/h)" traffic, showing vehicle flow degrading to "D-HEAVY" with queues escalating past +157 backed-up vehicles and delay/car reaching 4.4 minutes.
- [00:31] Switching to the maximum traffic tier, "Meltdown (5,500/h)", causing LAX delay to spike to over 4.9 minutes with +434 backed-up vehicles.
- [00:40] Switching to ATL under "Meltdown (5,500/h)", showing traffic remaining relatively resilient at "B-STABLE" (54s delay/car, +231 backed-up vehicles).
- [00:50] Switching to DEN under "Meltdown", showing traffic degrading to "C-BUSY" with 2.2 minutes delay/car and +545 vehicles backed up.
- [00:54] Returning to LAX under "Meltdown", which drops to "E-CONGESTED" with severe multi-terminal gridlock, queue backlog surpassing 1,220 vehicles, and average delay per car reaching 7.9 minutes at 9 mph.
Claims & numbers
- Four selectable traffic volume settings are defined: Quiet (800/h), Typical (2,400/h), Holiday (3,800/h), and Meltdown (5,500/h).
- Under "Typical" (2,400/h) traffic, DFW has a 15s delay/car (24 mph), ATL 19s (24 mph), DEN 20s (21 mph), ORD 44s (19 mph), and LAX 2.6m to 3.4m delay/car (14–15 mph).
- Under "Meltdown" (5,500/h), LAX backlog scales from +505 to +1,220+ vehicles, vehicle speed drops to 9 mph, and average delay climbs to 7.9m per car, rating it "E-CONGESTED."
- Under "Meltdown" (5,500/h), ATL sustains "B-STABLE" conditions with an average car delay of approximately 54s at 16 mph.
Notable quotes
- [00:00] Text on screen: "One-way horseshoe passing nine terminals in series creates severe choke points"
- [00:15] Text on screen: "Five semicircular terminal loops branching off spine distribute traffic effectively"
- [00:40] Text on screen: "Central terminal with split north/south curbs, parallel lanes keep flow moving"
Assessment This is a real screen recording of a functional web/mobile application created as a software demonstration. The simulation logic, animations, and responsive interface are displayed live on a mobile screen without visible deceptive cuts.
Lyrics & themes
- The video is completely silent screen-capture footage with no background music, sound effects, or voiceover.
- The thematic focus of the simulation is civil engineering and urban traffic design—specifically demonstrating how airport roadway topologies (horseshoe loops vs. decentralized parallel loops or branches) handle exponential traffic spikes.
Lore & references
- Claude Opus 5.5: Anthropic's flagship frontier model released in late September 2026, known for end-to-end coding capabilities that allow building fully realized interactive web apps from scratch in single sessions.
- LAX Curbside Horseshoe: A well-known real-world infrastructure pain point frequently criticized by travelers and urban planners for systemic gridlock during peak holiday travel.
Visual style & craft
- The visual presentation consists of a sleek dark-mode mobile UI designed in the style of iOS telemetry dashboards.
- Visual elements feature clean SVG/Canvas track vector graphics with animated vehicle particles colored according to status (green for moving, orange for slow, red for stopped, cyan for stopped at curb).
- Real-time animated counters, speedometers, and delay meters update continuously as the simulation clock runs.
Described by gemini-3.8-flash on 2026-10-05 from the video's audio and frames.